
My role
I led the responsive redesign of Financial Aid TV's flagship video service under aggressive timelines—launching on time and on budget in September 2016.
CLIENT PARTNER
Pitched, procured and led this Lean UX design project. I authored all presentations and managed expectations with 10 stakeholders in 5 states.
Strategic Partner
Led and conducted qualitative and quantitative research to understand user needs, business goals, define design goals and establish measures of success.
UX DESIGN LEADER
Translated discovery findings into a focused design vision and detailed plan to address highest priority user needs, business goals, and technical feasibility.
UX Design PRACTITIONER
Created design prototypes and performed 2 rounds of usability testing on early design prototypes. Produced 100+ responsive screens and style guides for build.
Development Partner
Partnered with stakeholders and developers to continuously sync design, feasibility, and organizational readiness.
Live demos
Financial Aid TV's 200+ redesigned client portals launched in August 2016.
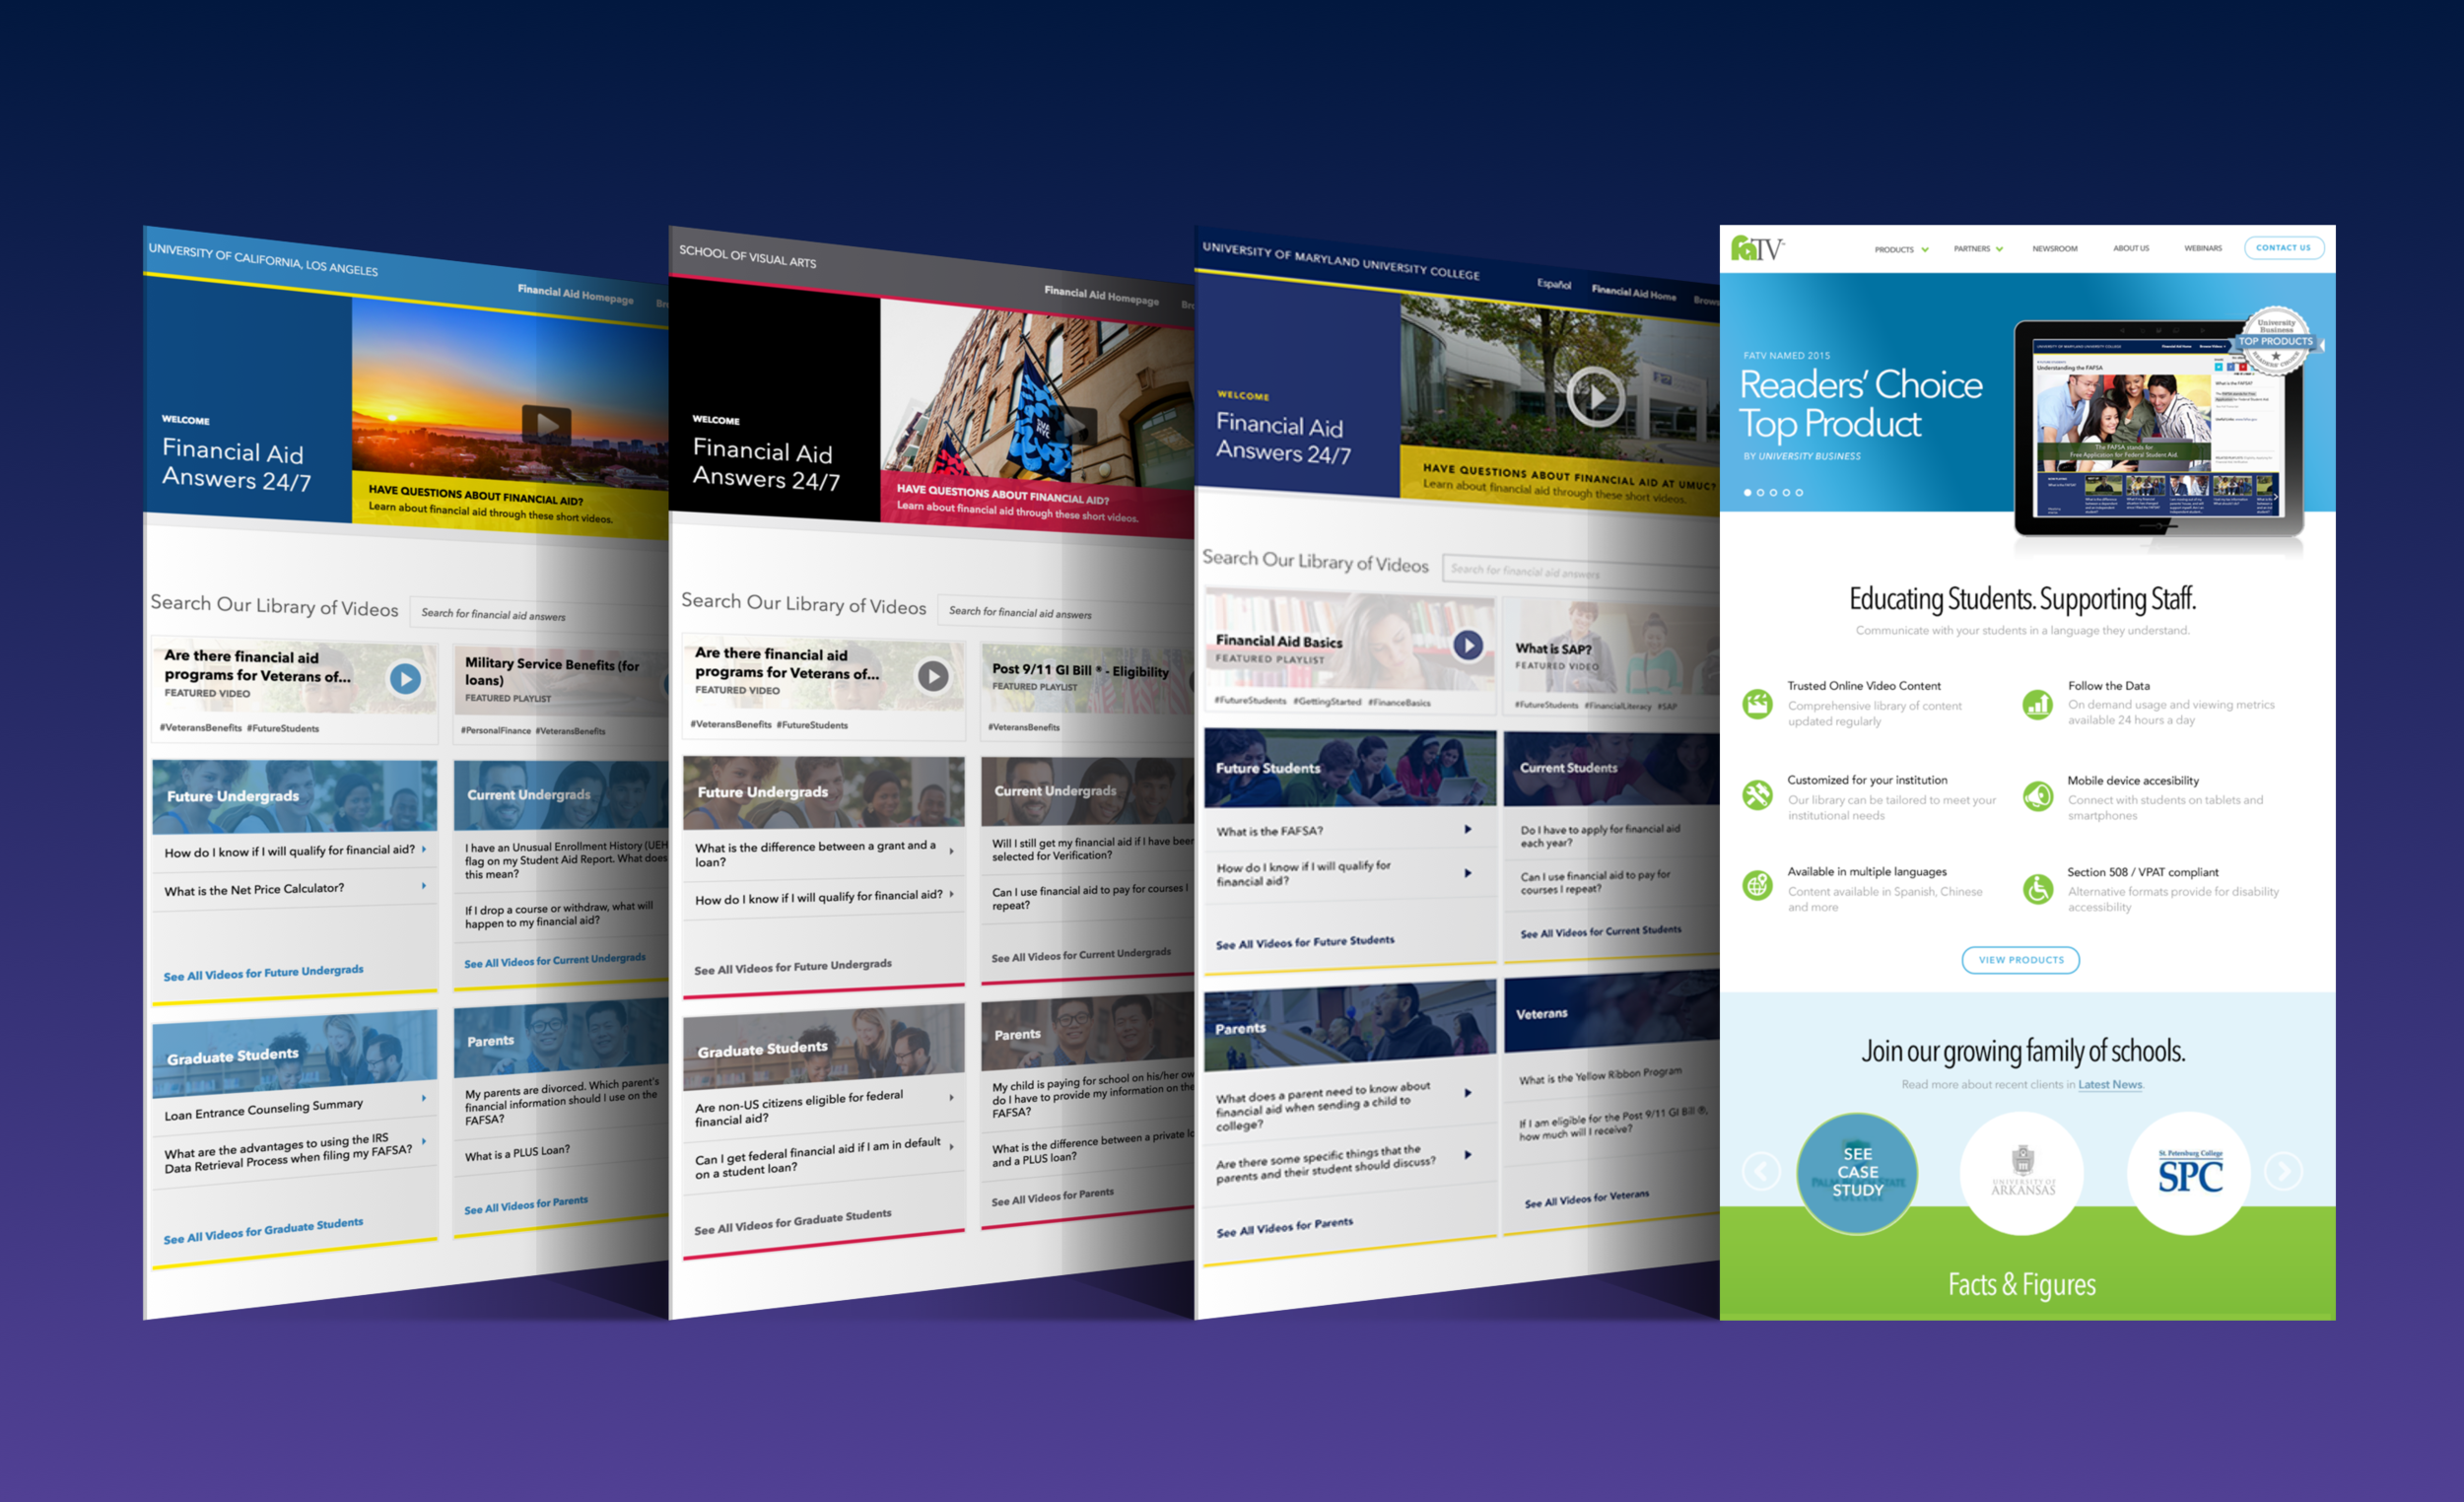
The challenge
The nature of the topic—finances—can overwhelm anyone. FATV's video portal provides "one question and one answer at a time," making complicated financial aid topics digestible. Videos are curated into playlists to guide the user on a learning path.
Business goals
It had been a while since FATV's GetAnswers video portal had received a design update. The client's goals were:
CONTEMPORARY DESIGN AND 508 COMPLIANCE
While it's true that an antiquated design would poorly impact any measure of success; I consider both of these baseline requirements, rather than specific goals. What's specific to FATV is designing a scalable platform for FATV's 200+ client portals, school logos, colors, premium features and content.
Increase VIDEOS WATCHED
FATV served up 4 million videos in 2015. They are tremendously proud of this number; and they should be! It provides social proof for marketing saying, "These guys are the real deal if they have 4 million hits per year."
But hits alone don't tell us about the user experience. For example, if a user watched a 10 videos for 3 seconds but didn't find what she was looking for, then our hits metric would consider this a success. I wanted to find a better measure for user satisfaction and engagement.
Improve user experience
To measure success for improving the user experience, I was looking for a couple things post-redesign:
- Increase end user satisfaction ratings
- Increase client Net Promoter Scores (NPS)
- Increase engagement or videos watched 50% through completion. I hypothesized that some of FATV's 4 million hits was due to users clicking around while getting lost in the interface.
- Understanding of what is working and why in usability tests on the redesigned product
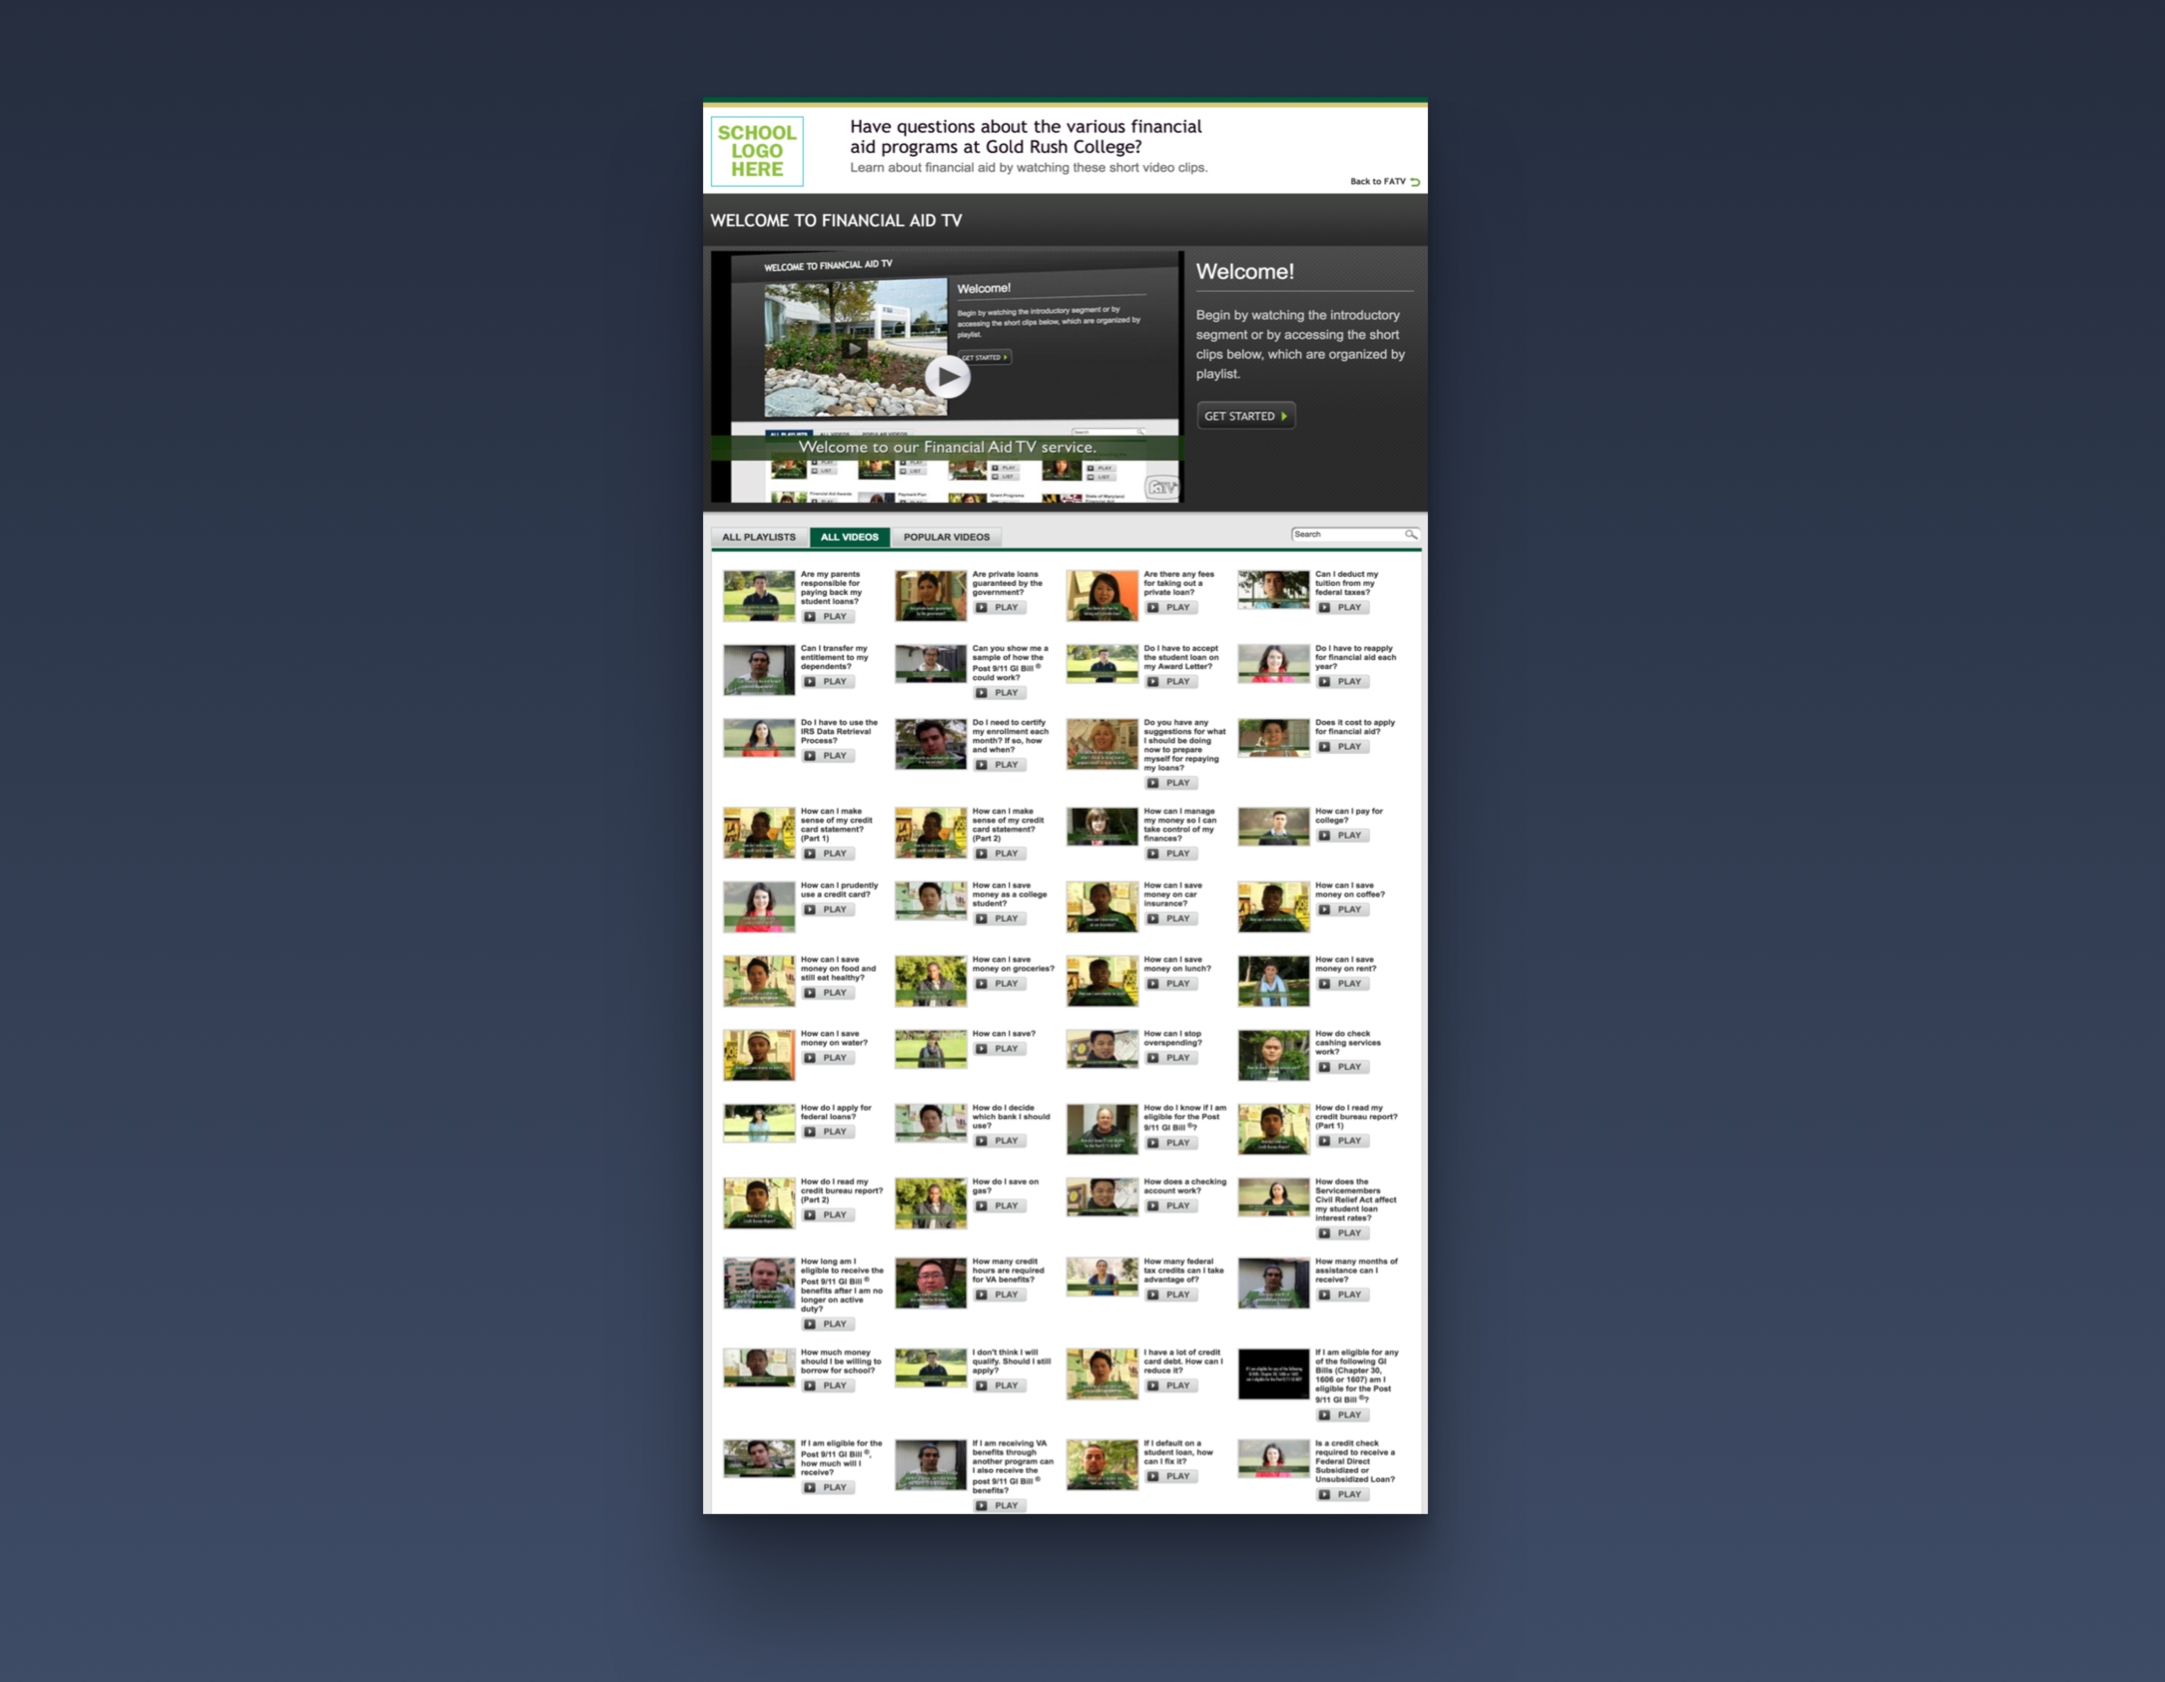
Financial Aid TV portal before the redesign.
A closer look..
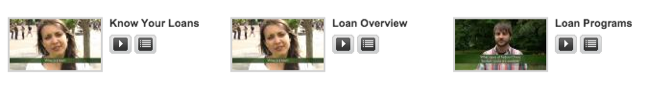
It's hard to tell promos apart.
- Each promo looked like a single video, hiding the fact it is a full playlist of video answers.
- Video thumbnails and titles did not provide enough differentiated information about what was in the playlist.
- Repeated thumbnails made promos look like duplicate content.
User insights
FATV is B2B, licensing their portal to colleges and universities. Improvements to FATV's user experience involve two sets of users: FATV's clients and their product's end-users.
Digging into third party research and FATV's marketing data I gathered insights about FATV's users. User data and profiles are the IP of FATV. It's worth noting that as of 2016, most college students are over 25. This meant I was not designing the next coolest whiz bang thing for college kids. I was designing an information workhorse for adult users.
Identifying pain points
A heuristic evaluation uncovered a list of navigation, labelling and usability issues in the existing interface. Rather than conduct usability tests on the existing interface (to uncover a redundant list of our obvious issues) I conducted surveys to get voice of the consumer suggestions and set a baseline for success metrics.
Loud and clear, we heard clients and users reiterate my concerns about navigation and information findability.
This is the part where I cheated a bit. In the past, I've worked on media sites where we worked with lean back / lean forward media consumption. I made an educated guess and translated that into learning mode / discover mode for FATV.

User need
Learning mode
Similar to the lean back, FATV's learning mode is when a user is consuming video playlists back to back. FATV has nailed this mode. Their content answers a single question which leads into the next question and answer.
“It’s just one question and one answer at a time. That makes it [the financial aid information] really digestible.”
User need
Discovery Mode
Users are actively seeking new information in discovery mode. Users do a combo of targeted search and serendipitous content discovery. This is the area that needed the most focus for UX improvements.
“The [financial aid video] portal is too complicated. I don’t know how to phrase my search to find the video I need.”
“The search field is not very effective, it brings up too many results. When I type in ‘IRS’ it brings up about a hundred videos.”

The vision
Make relevant content easier to find by improving information design, search and browse relevance required an overhaul of user flows, user interface and content strategy.
Simplifying flows
Choreographing discovery and learning
The old portal used one page for learning and discovery, overwhelming the user with options. So the first step was to break the experience into smaller, more digestible chunks. The dedicated search and browse allows a user to focus on information finding, then enter learning mode once a topic is found.

Simplifying the interface
Balancing information richness and visual simplicity
“All information and interaction rich interfaces need to strike an appropriate balance between visual simplicity and information density.
Visual simplicity keeps things clear and focused. Information density provides choices to match different user needs and behavioral patterns.”

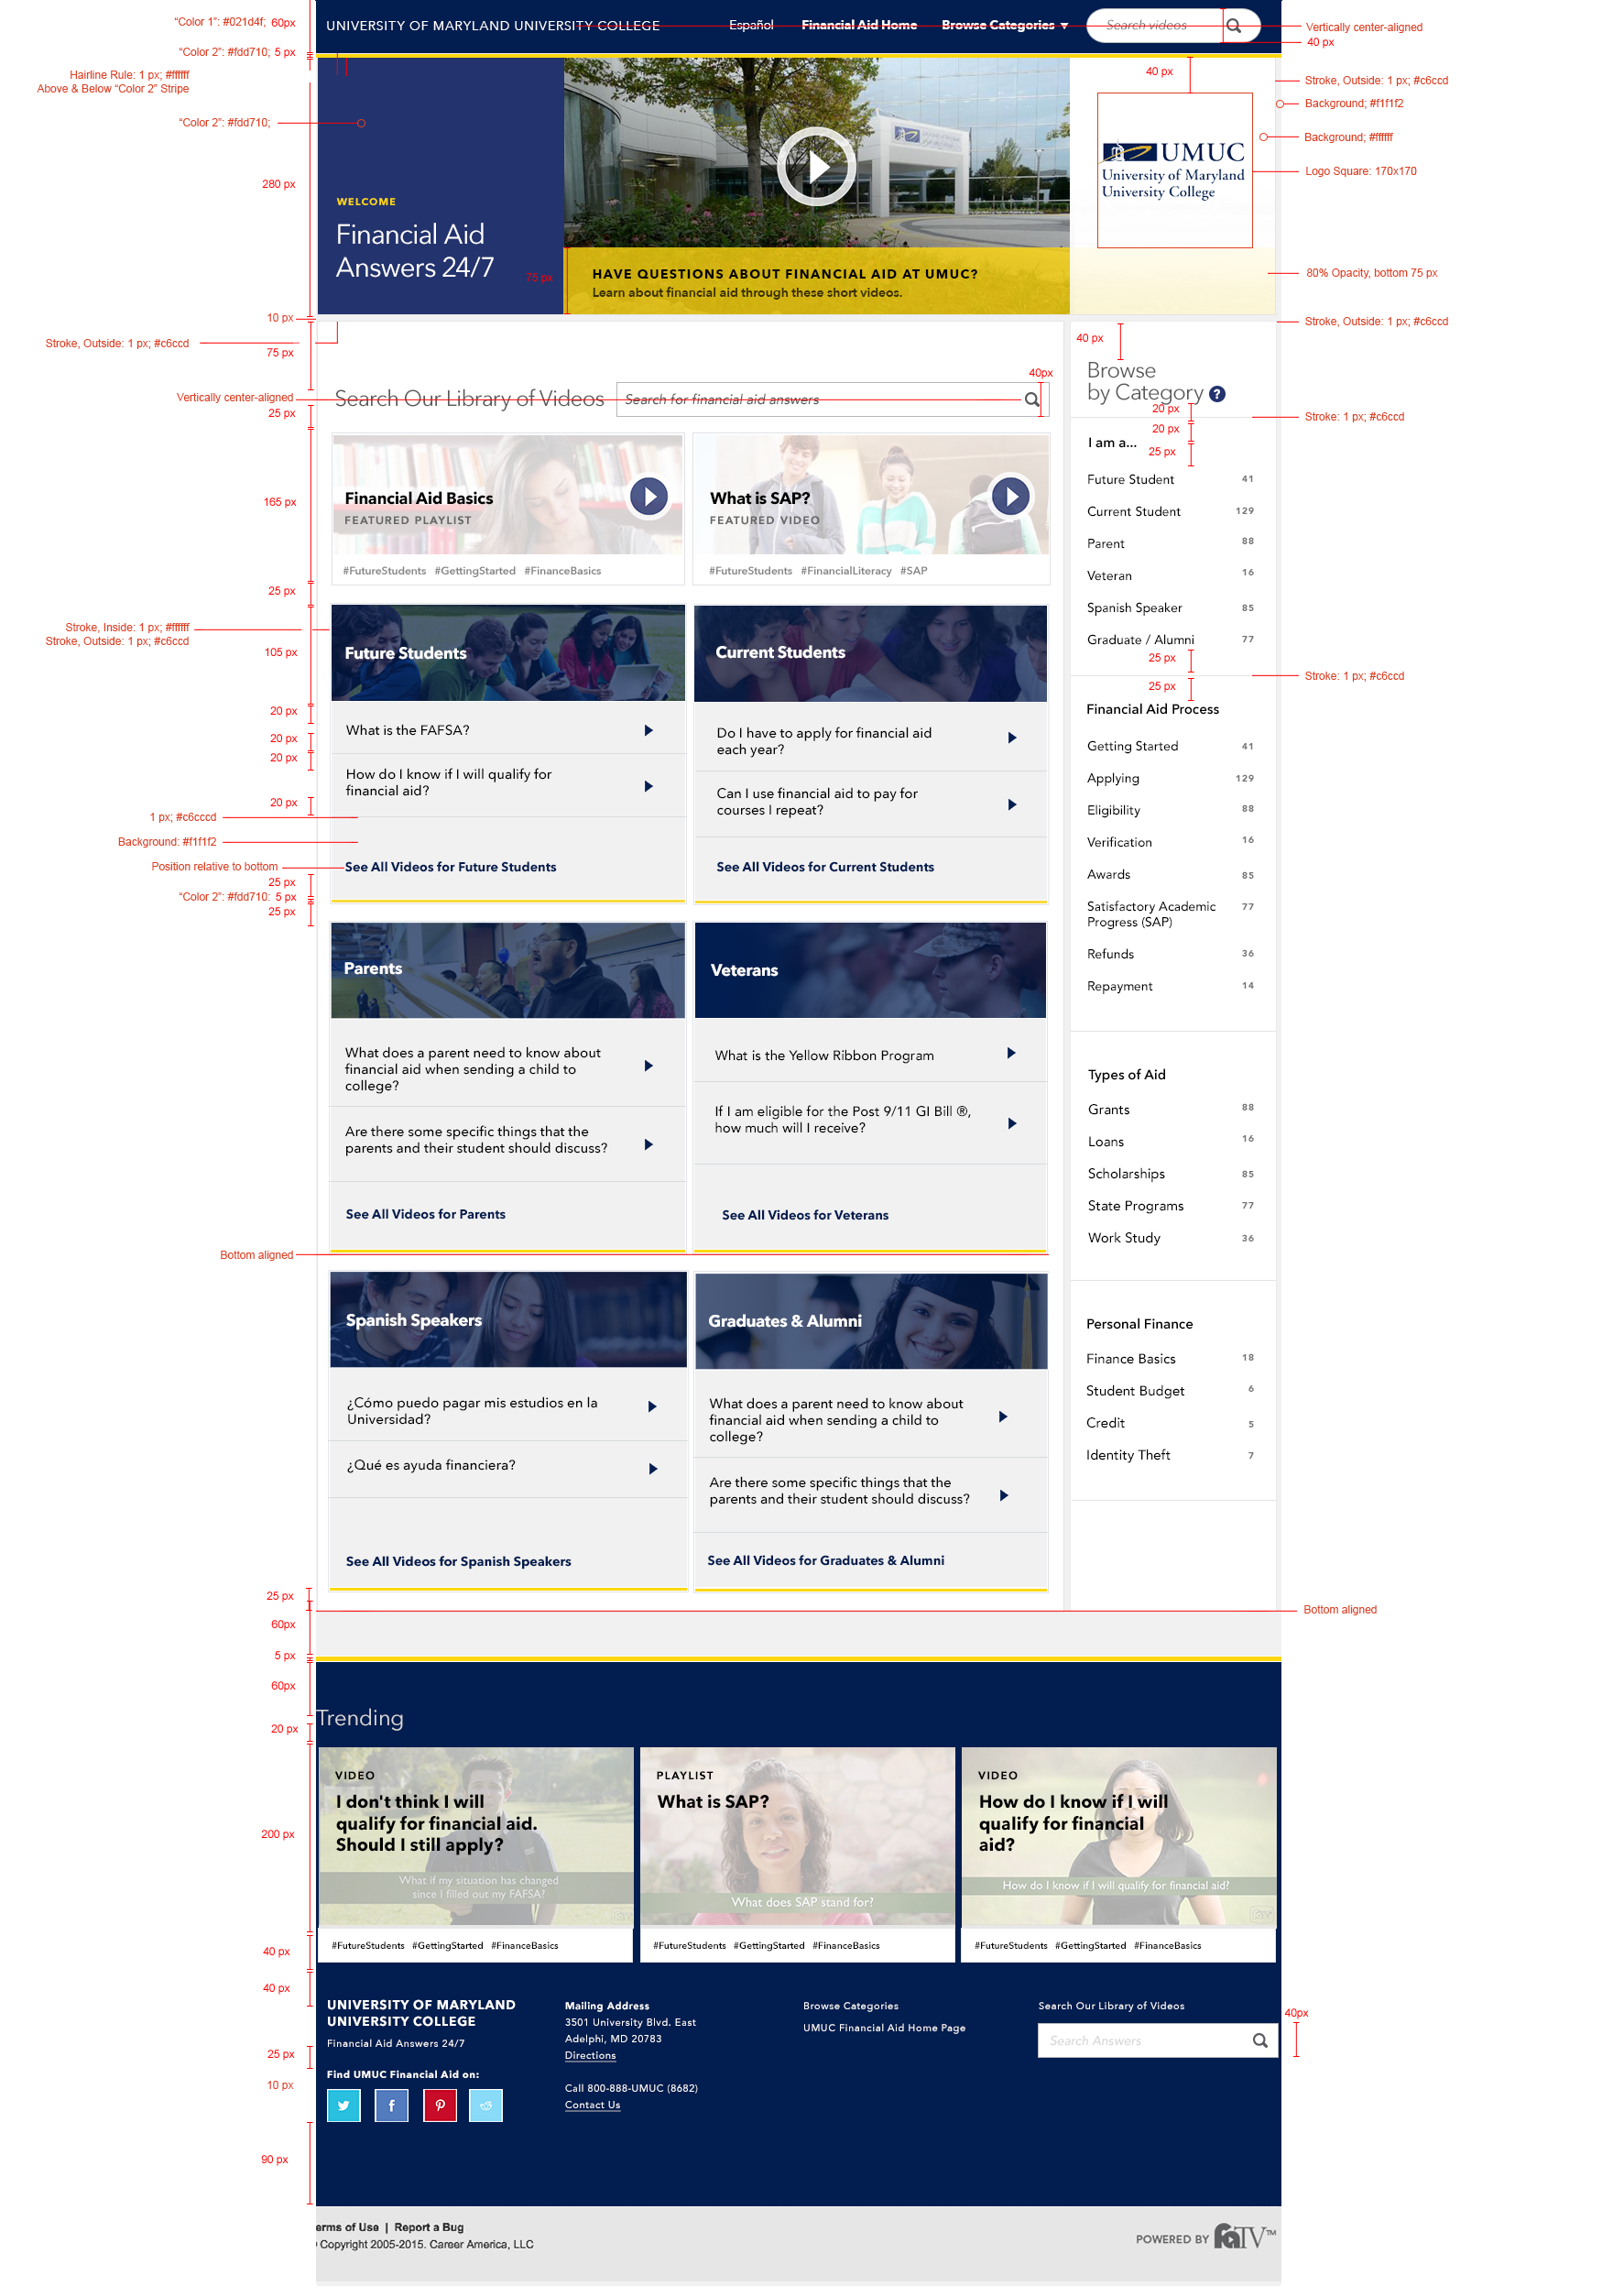
The new FATV portal uses scannable lists in an information dense interface.
Fixing search
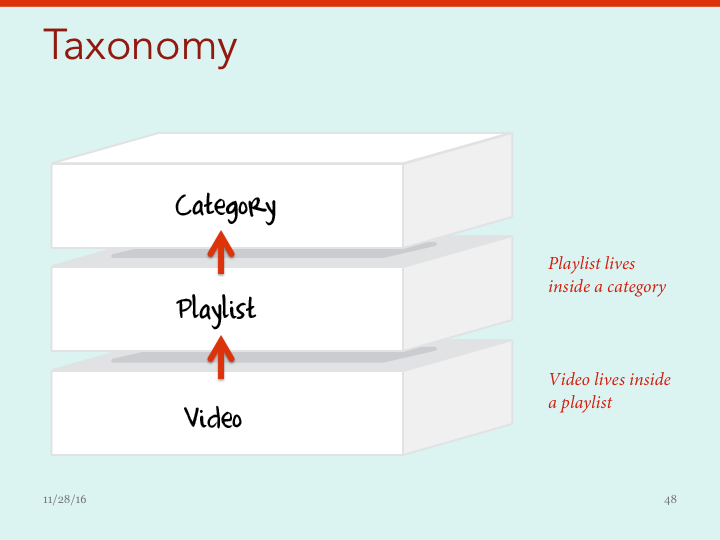
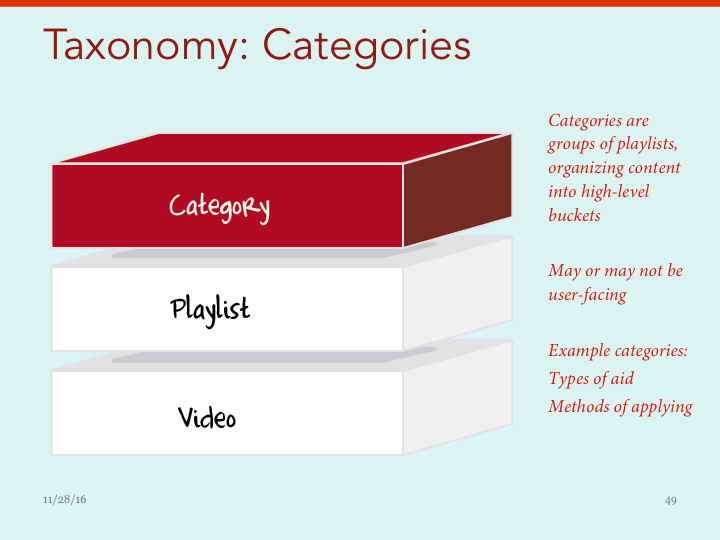
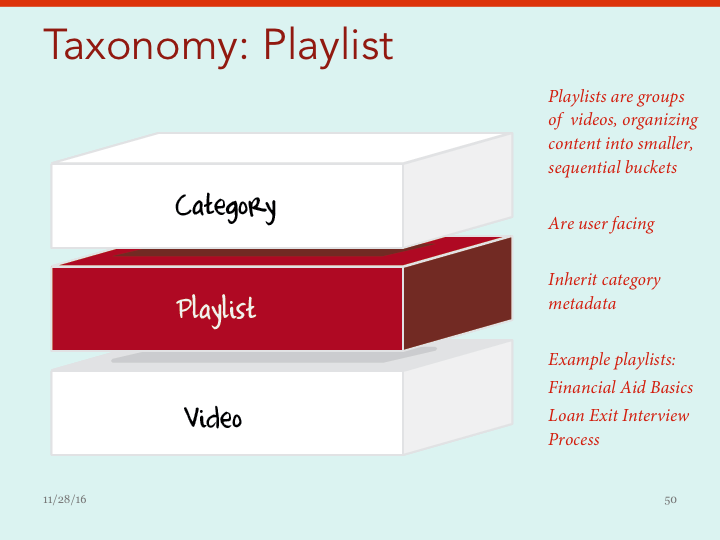
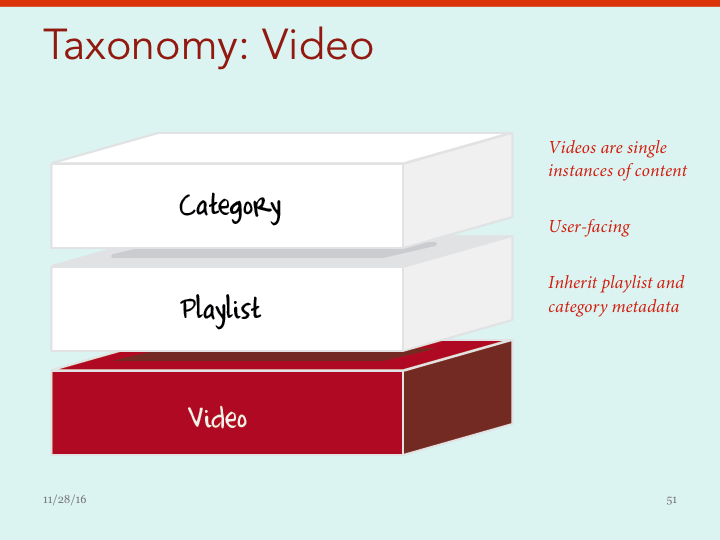
Tagging and organizing for improved relevance
Faceted browse and topic tags drive content findability in the new video portal. Below is my proposed system of tagging hierarchy and inheritance.
Content strategy got the most push-back
I was prepared to defend big ideas that moved FATV in a different direction. I took away all of their playlist thumbnails and, surprisingly, they loved this idea!
However, content strategy required a lot negotiation on this project. Here are a couple examples:
- Suggestion: Dynamically tag content with inheritance from a taxonomy of nested categories to streamline editorial workflows, ensure clean data, and simplify system-wide tagging updates (see slides above).
Pushback: Tag each piece of content individually with flat tags for greater control over data assigned to each node.
- Suggestion: Selectively assign individual tags manually to provide distinct, specific and highly relevant navigation filtering categories.
Pushback: Exhaustively tag each piece of content with all tags that apply to it to showcase as much content as possible in all navigation categories.
No model survives first contact with real content
Our beta product revealed a problem with the client's preferred manual + exhaustive tagging model. Navigation filters displayed the exact same content from category to category because most content shared the same tags. Luckily, we discovered the problem early enough for the client to manually retag content and revise display rules in time for launch.
Usability testing
I conducted two rounds of usability testing on an early design prototype. The prototype used my recommended taxonomy, content density, and used real content in simulated search results.
To eliminate possible moderator bias with testing my own designs, I used an external usability vendor Nicole Rubin at Common Sense Consulting.
Here's what's crazy. Nicole had a hard time writing a report because users sailed through the design prototype as if it was invisible, as if it was exactly what they expected. How about that?
So why did we do two rounds of testing? We wondered if participants in our first test were an anomaly. Nope. The second set of tests yielded the exact same results.
“I don’t notice the design because when it is intuitive and has what you want without the clutter, you just don’t notice the design. I like it a lot – the sections, the populations.”
Product Lead
I worked closely with the client and development lead to turn my design prototype into the live product.
Designs were delivered in a rolling cycle of 3 batches. So while I was working on batch 2 designs, the build team could begin working on batch 1. In weekly QA calls, we collaborated to continuously sync design, feasibility, and organizational readiness.
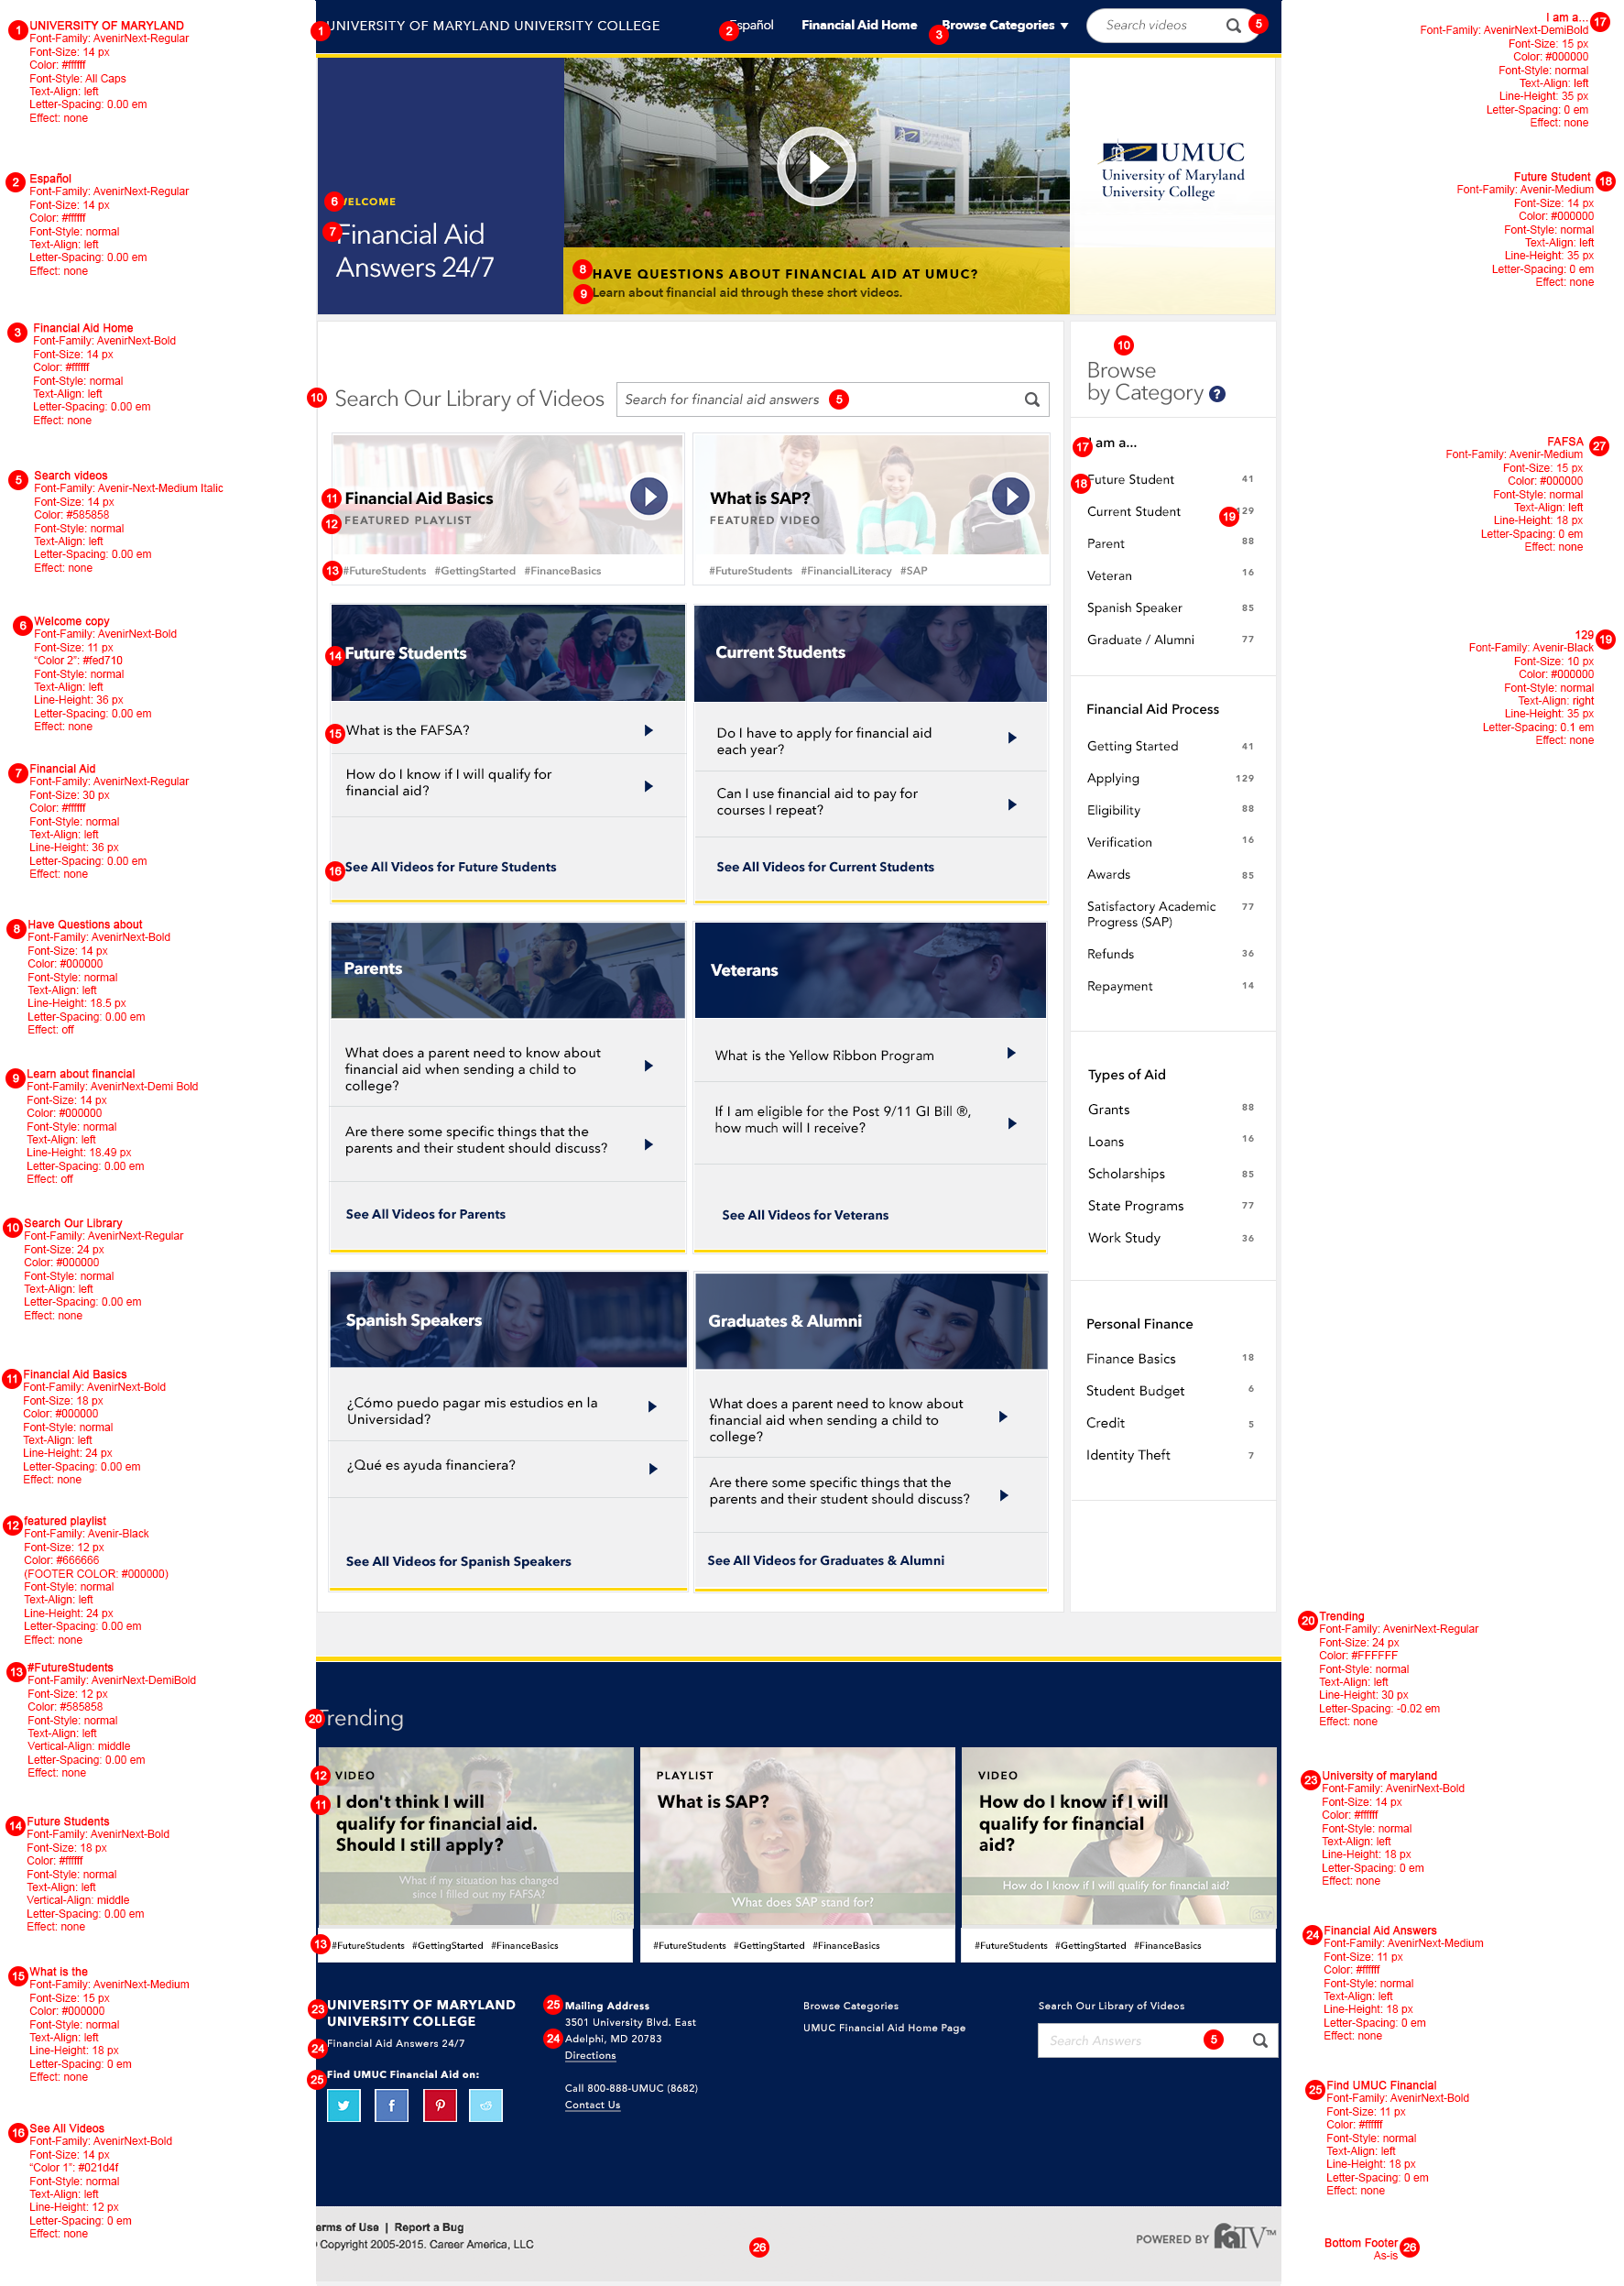
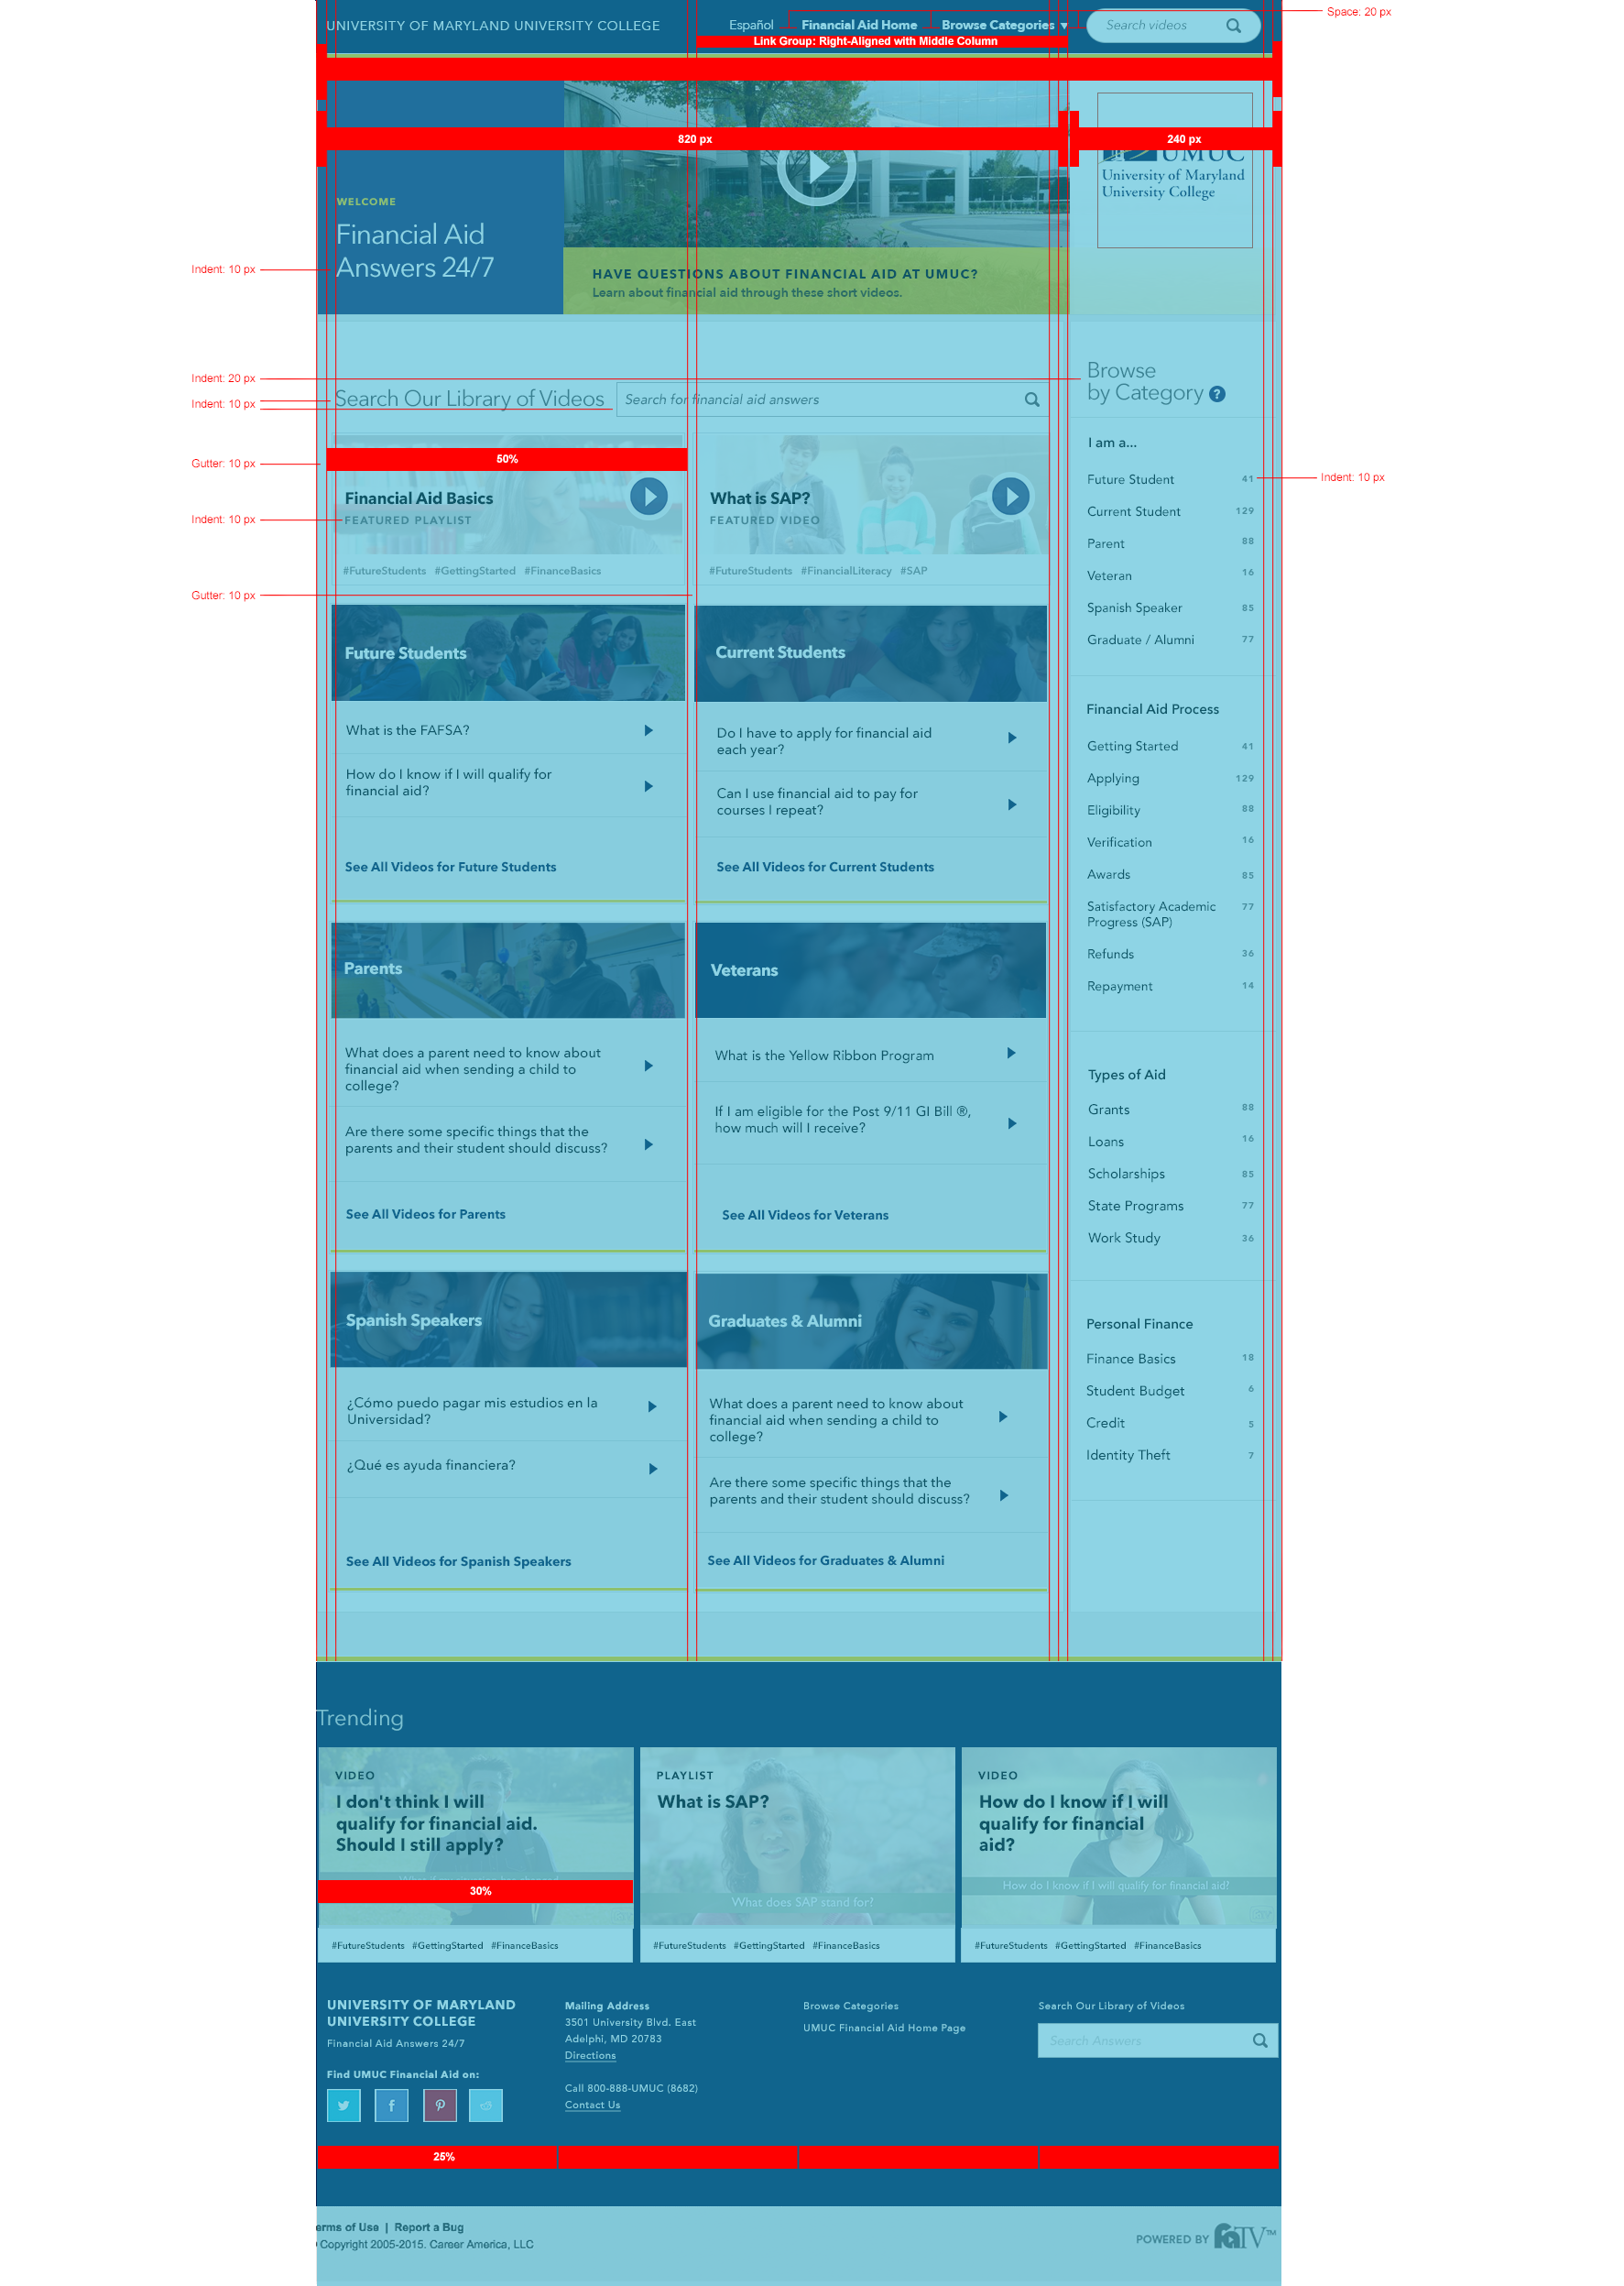
Here are a few screens from my design specifications.
The Result
As of November 2016, FATV is collecting feedback and usage data on our redesigned portal. More to come as results are analyzed.